Learning Standard Report
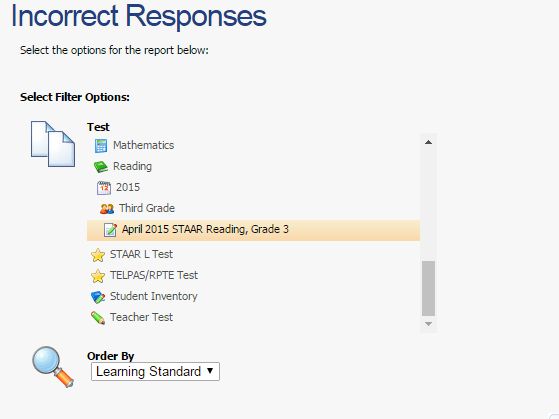
This report is only available for teachers. This report can be found in the Reports section of Aware. After you click on the reports button then choose the first report called Incorrect Responses Report. After selecting the report you will drill down and choose the test, you can choose by class period or by all students. Finally you will change Order by Question to Learning Standard. See an example of the report below.
| Learning Standard Report Example |
|
|
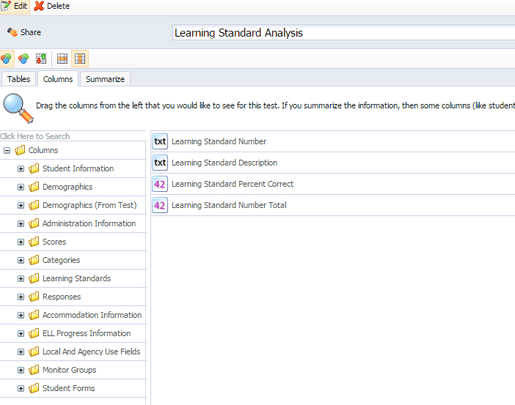
Learning Standard Anaylsis
This a dataview that can be created in the system by an administrator and then shared out as a template. Here are the fields to make this view:
- Learning Standard Number
- Learning Standard Description
- Learning Standard Percent Correct
- Learning Standard Number Total
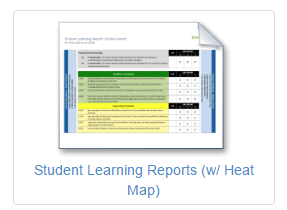
Student Learning Report (lead4ward):
Student Learning Report does a great job of aggregating data in order to narrow down areas of focus. This report can also be found in the Reports section. The teacher can choose up to 3 checkpoints to look at and aggregate data with this report. My suggestion is to aggregate all unit assessments under one checkpoint then add one or benchmarks on the other checkpoint. Leave the final checkpoint box blank so the teacher can use this section to star or mark areas on need.
*Remember to focus reteach on areas the teacher knows well and it able to easily change the learning design
*Remember to focus reteach on areas the teacher knows well and it able to easily change the learning design
Questions to ASk:
- What does data tell us?
- Did they guess?
- What concepts are this kids struggling with?
- Did they get too tired and lack perseverance?
- Do they need question starter strategies?
- Do they need time management strategies?
- Do they need help with competence or confidence?
- Do they have gaps and what are they?
Lead4ward: Evaluating Student Needs
|
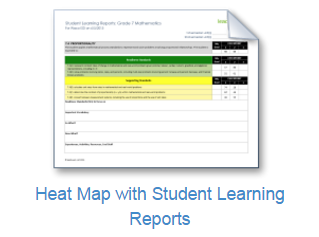
Heat Maps are data visualizations that create color-coded "maps" of student performance at the student expectation (SE) level of the TEKS. Additional tabs are included for Student Learning Reports.
Student Learning Report does a great job of aggregating data in order to narrow down areas of focus. *Remember to focus reteach on areas the teacher knows well and it able to easily change the learning design |
|
|
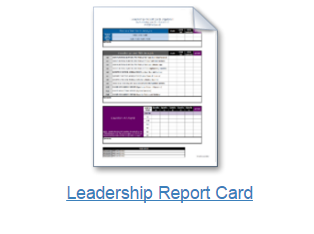
Leadership Report Cards are versions of Heat Maps that can be used by district and campus leaders to analyze aggregated local assessments at each grading period/cycle. These specially customized reports will populate with STAAR data and relevant local assessments designed as a part of a comprehensive district/campus assessment program.
|
|
|
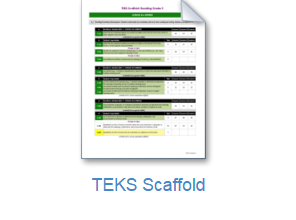
TEKS Scaffolds are great tools for vertically aligning student expectations (SEs) and investigating concept development across grade levels. TEKS Scaffolds are organized by Process and Readiness Standards as individual tabs on the report. Each Checkpoint for the report may be populated with selected STAAR test data in either aggregated or single-year format.
|
|
|
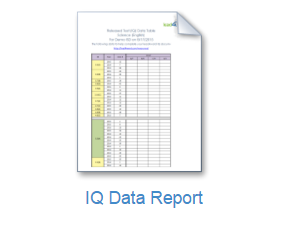
The IQ Data Report will populate with the STAAR response data for a campus or district and can be used to more-easily complete a lead4ward IQ document. For lead4ward IQ documents, please visit the lead4ward Resources page.
|
|